Cloudy with a chance of muons
Learn more about event displays, physicists’ pictures of particle collisions
Written by:
Emma Hattersley
—
When you want to capture an important moment in your life, you often take a photo. You could write down the key details instead – who you were with, where you were, the time of day – but this information might not be as impactful as a picture of the event. Physicists like to record particle collisions in a similar way using so-called “event displays”, but producing these is a little more complicated than snapping a picture with your phone.
At the Large Hadron Collider, particles are accelerated to almost the speed of light before colliding within detectors around the ring to produce even more particles. Researchers use detectors to measure various properties of these particles in order to reconstruct the collision and determine which new particles may have been created.
Event displays are simplified visualisations of the information collected by these detectors, designed to help researchers to better understand a collision, as well as revealing any problems with the detector or the software used to process the data. Every LHC experiment creates event displays slightly differently, as their detectors are very different, but most contain similar key features.
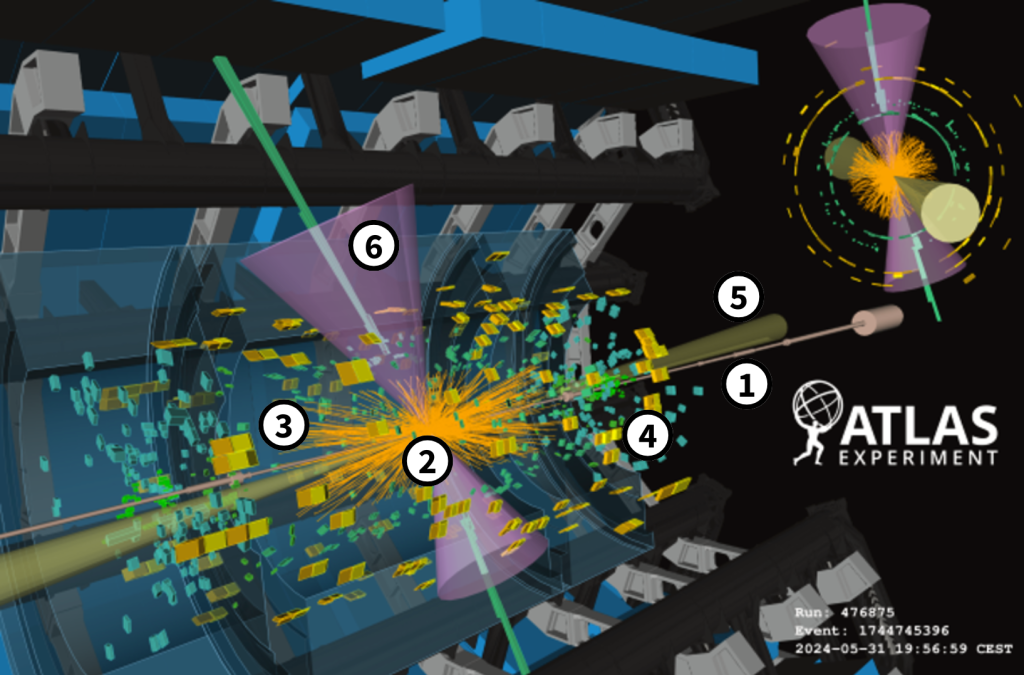
In the above event display, for example, we see two straight lines (1) representing the beamlines that contain incoming particles, which collide at the collision point (2). Charged particles produced by these collisions are subjected to magnetic fields by the detector, causing them to move away from the collision point in curved paths that are reconstructed by the inner tracking detectors. Shown here as gold lines (3), these paths allow physicists to measure particle momentum, as particles with lower momentum take a more curved path than particles with higher momentum.
The small yellow and teal cubes (4) represent readings from calorimeters, which measure the energy of particles that hit them. Together with tracks from the inner detectors, these measurements are used to group particles into collimated sprays of particles called jets, shown here as narrow yellow cones (5). These jets give information about the quarks and gluons scattering in the heart of the proton collisions. One of the calorimeters also helps researchers to identify photons, shown here as purple cones (6).
Event displays serve as a reminder that the vast amount of data produced by CERN experiments each year is not just ones and zeros, but a record of the billions of particle collisions that take place in the Large Hadron Collider every second. With the High-Luminosity LHC expected to facilitate a dramatic increase in particle collisions, we can expect to see even more exciting event displays in future.